What's allowed to wake me up
Running my home cluster like production: Cilium and Hubble, dashboards, pages only when something is broken, a UPS, and tests that break it on purpose.
This is the second of two posts about my home cluster. The first was about why it’s built the way it is, what runs on it, and the practices behind it. This one is about running it: how I see what’s going on, when something is allowed to interrupt my evening, and how I know it actually holds up. I’ll finish with an honest scorecard, as if it were a production service.
It starts with the change that replaced the network under everything.
From Calico to Cilium, and Hubble#
Every Kubernetes cluster needs a network plugin to give pods addresses and move traffic between machines. microk8s comes with Calico, and I ran it for months without thinking about it.
Then, in June, after a power cut, the storage system started marking one machine as “not ready” every minute or so. Each time it did, it abandoned the rebuild of every volume and started again from zero, so the cluster never recovered. After a long day of digging, the cause was a bug in how that version of Calico maintained network routes: for a moment, every few seconds, the route to each pod disappeared, and the storage system’s health check happened to land in that gap often enough to fail.
I could have pinned a workaround. Instead I moved to Cilium, which handles pod networking with eBPF (small programs that run inside the Linux kernel) instead of a separate process keeping routes in sync. The migration was a day of work on a cluster that was already broken, which made the decision easy. The flapping stopped and hasn’t come back.
What I got on top is Hubble, Cilium’s network observer. It shows every connection between pods, live, with whether it was allowed or dropped. It turned network policies from guesswork into something I can check: write a policy, watch Hubble, see exactly which connection it dropped. It’s the tool I reach for whenever I write a new policy.
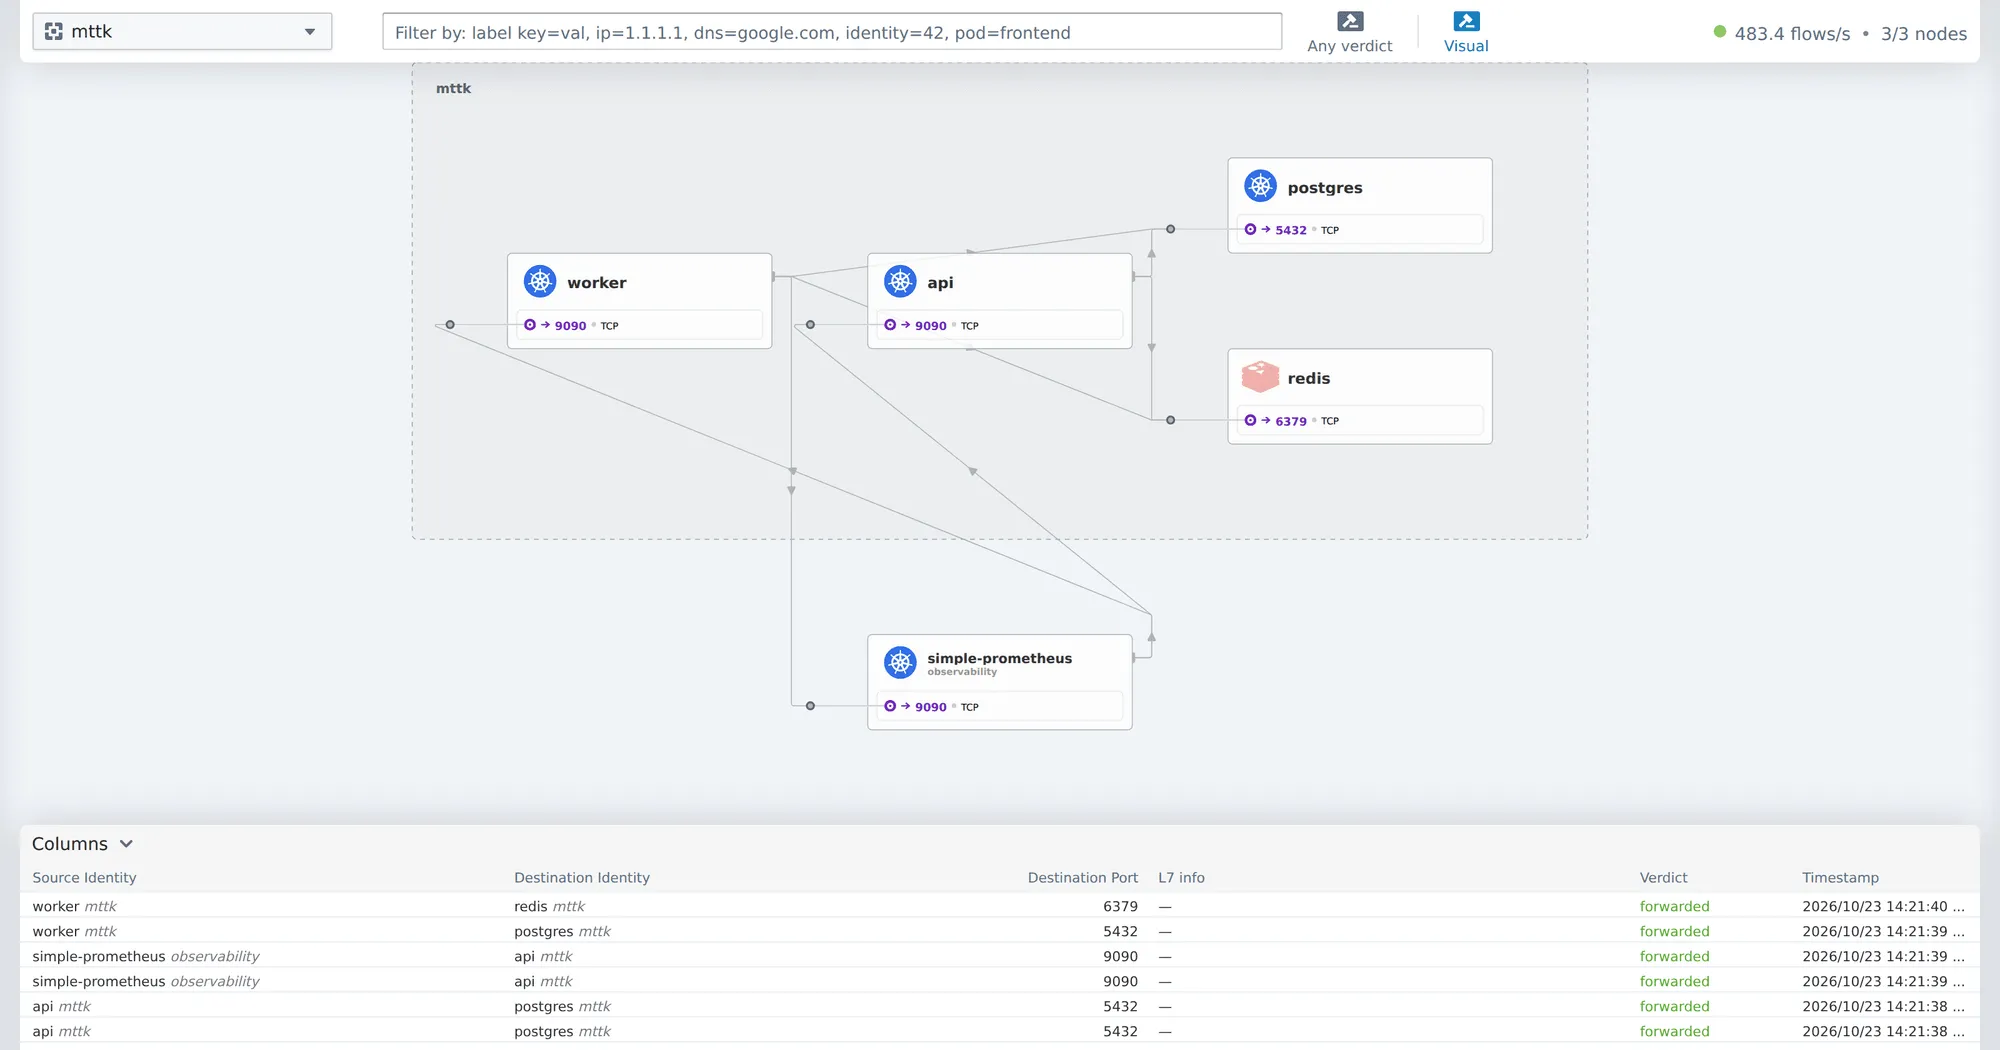
That’s Hubble’s map for MTTK, built from live traffic, not from a diagram I drew: the worker and the API talk to the database and the cache, and Prometheus comes in from the monitoring namespace to collect their metrics. Nothing else. Below it, every connection as it happens, with its verdict. When a new network policy blocks something it shouldn’t, the verdict turns red right there, with the source, the destination and the port.
Monitoring and dashboards#
- Metrics: Prometheus scrapes the machines, the cluster, the storage, the network and my apps.
- Logs and traces: Loki and Tempo, so a request in my own apps can be followed from the log line to every database call it made.
- Dashboards in Grafana, one per thing I’d want to look at when something’s wrong: the cluster, each app (with a row showing when each release happened), the UPS, the blog’s readers.
- Availability checks: every public site is checked every minute from outside, through Cloudflare, the way a reader reaches it, and from inside, at its home address. Seeing both tells me straight away whether the problem is the app or the path to it.
I deleted more dashboards than I kept. A dashboard nobody opens is just something else to maintain.
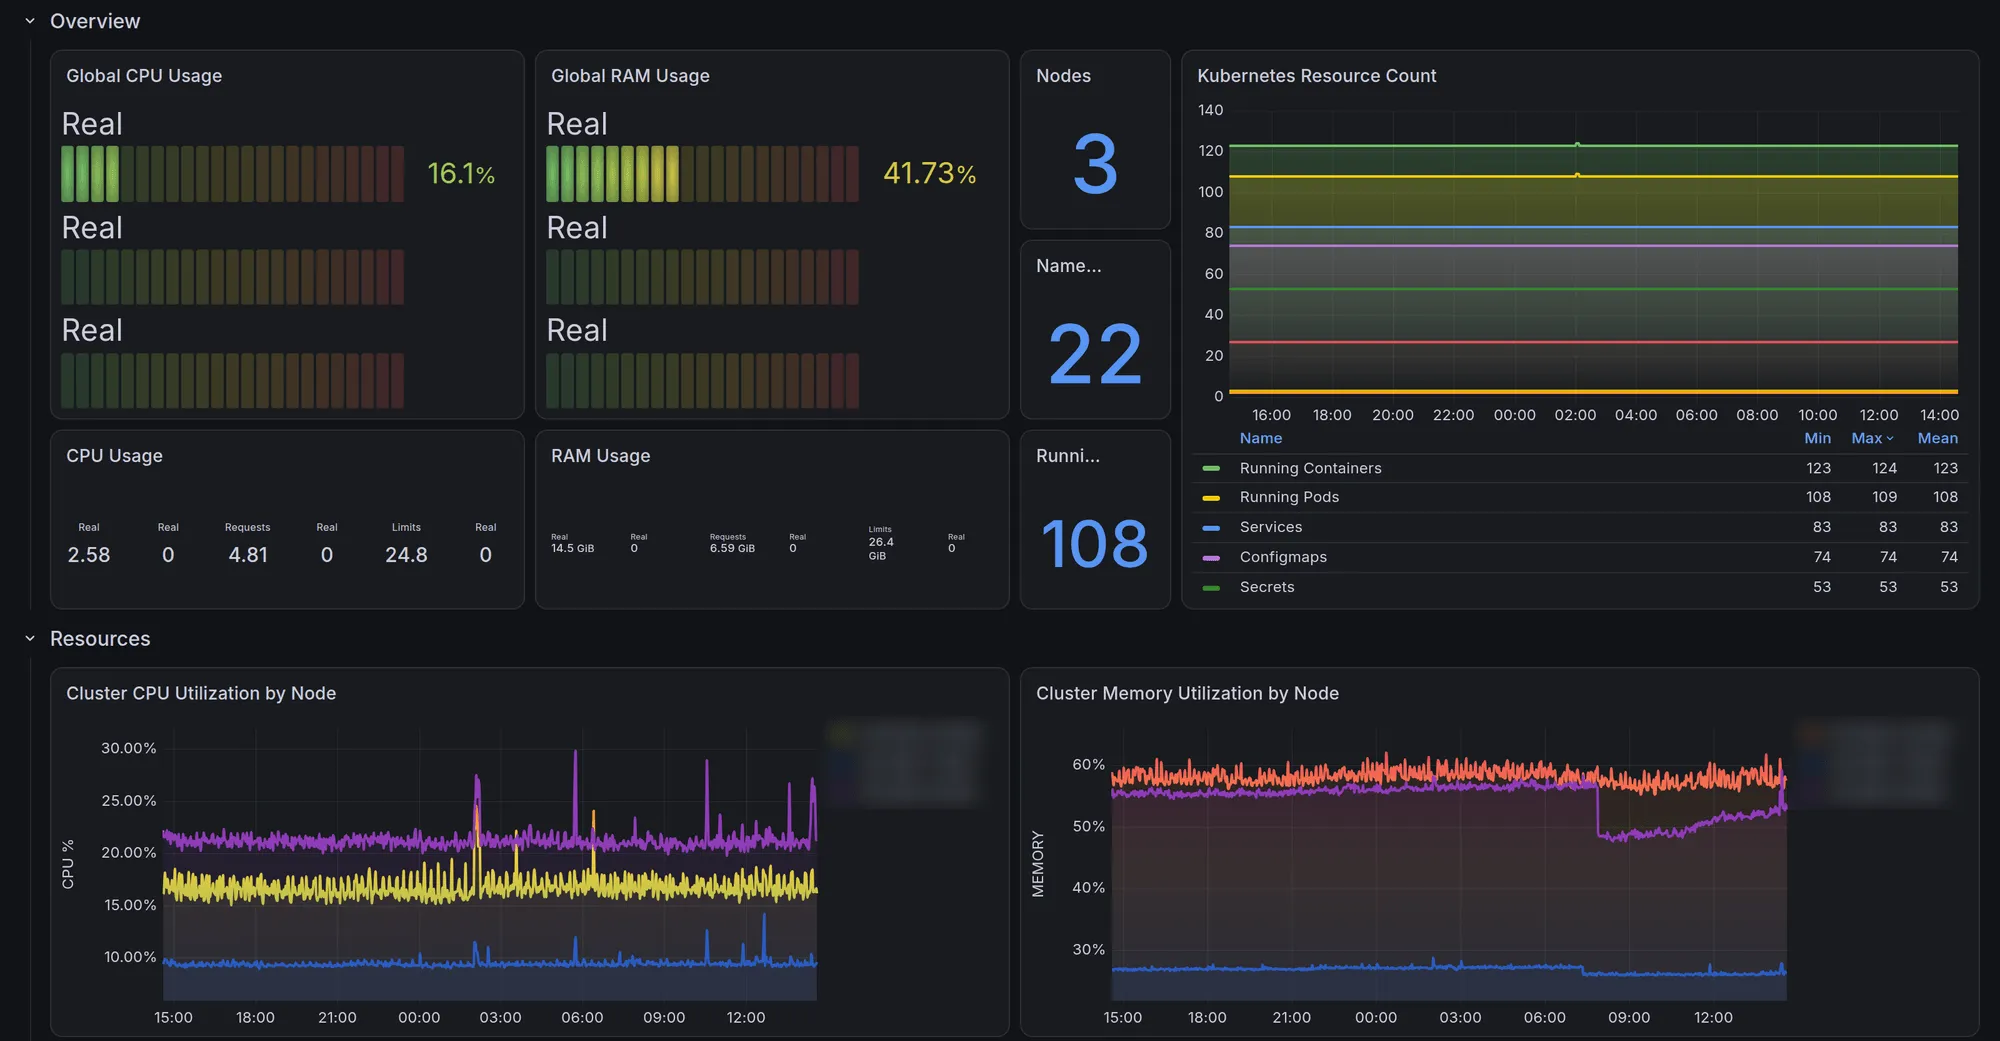
The one I open first is the cluster overview above: how much CPU and memory is in use, against what the apps have asked for and their limits, how many pods are running, and how each machine is doing. It answers “is the cluster itself fine?” in a few seconds, so I can move on to the app that’s actually broken.
Alerting: a page only when something is broken now#
This is the part I care most about, because it’s where home labs and real systems go wrong in the same way: too many alerts, most of them about nothing.
My rule is that every rule must need an action, and that only some of them are alerts. An alert is something that pages me, at any hour. A rule that fires and needs nothing teaches you to ignore the next one, and the next one might be the real thing.
So I have sixteen rules, and they come in two kinds:
- Pages: four of them. Something is broken for people now, or will be in minutes: a site down from outside for three minutes, an app down at its home address for two, the UPS about to run out, a disk about to fill. The two availability ones are symptoms, checked the way a reader would: through the public address, not from inside the app (though from a probe at home, which matters further down).
- Notifications: the other twelve. Things that need me, but not
tonight. They’re silent at night and I treat them like tickets for the
next day:
- early warnings that won’t fix themselves: the UPS on battery, a disk at 90%, the blog slow for most readers, a pod stuck without network;
- housekeeping with a deadline: security updates not installed, a machine waiting a week for its reboot, a newer Kubernetes version;
- and four that watch the watchers: if the checks or the metrics behind a rule stop arriving, silence would look like health, so that’s a notification too.
And nothing on causes. CPU at 90% isn’t a page or a notification. Memory near a pod’s limit isn’t either. I had those, and last week I removed them: in one week they fired for four different services, mostly because of file cache the kernel frees on its own, and not one container was actually killed. Those numbers live on a dashboard, for when a symptom sends me looking.
Every rule, page or notification, has a playbook linked from its message: what it means, what to check, how to fix it, and how I know it’s done.
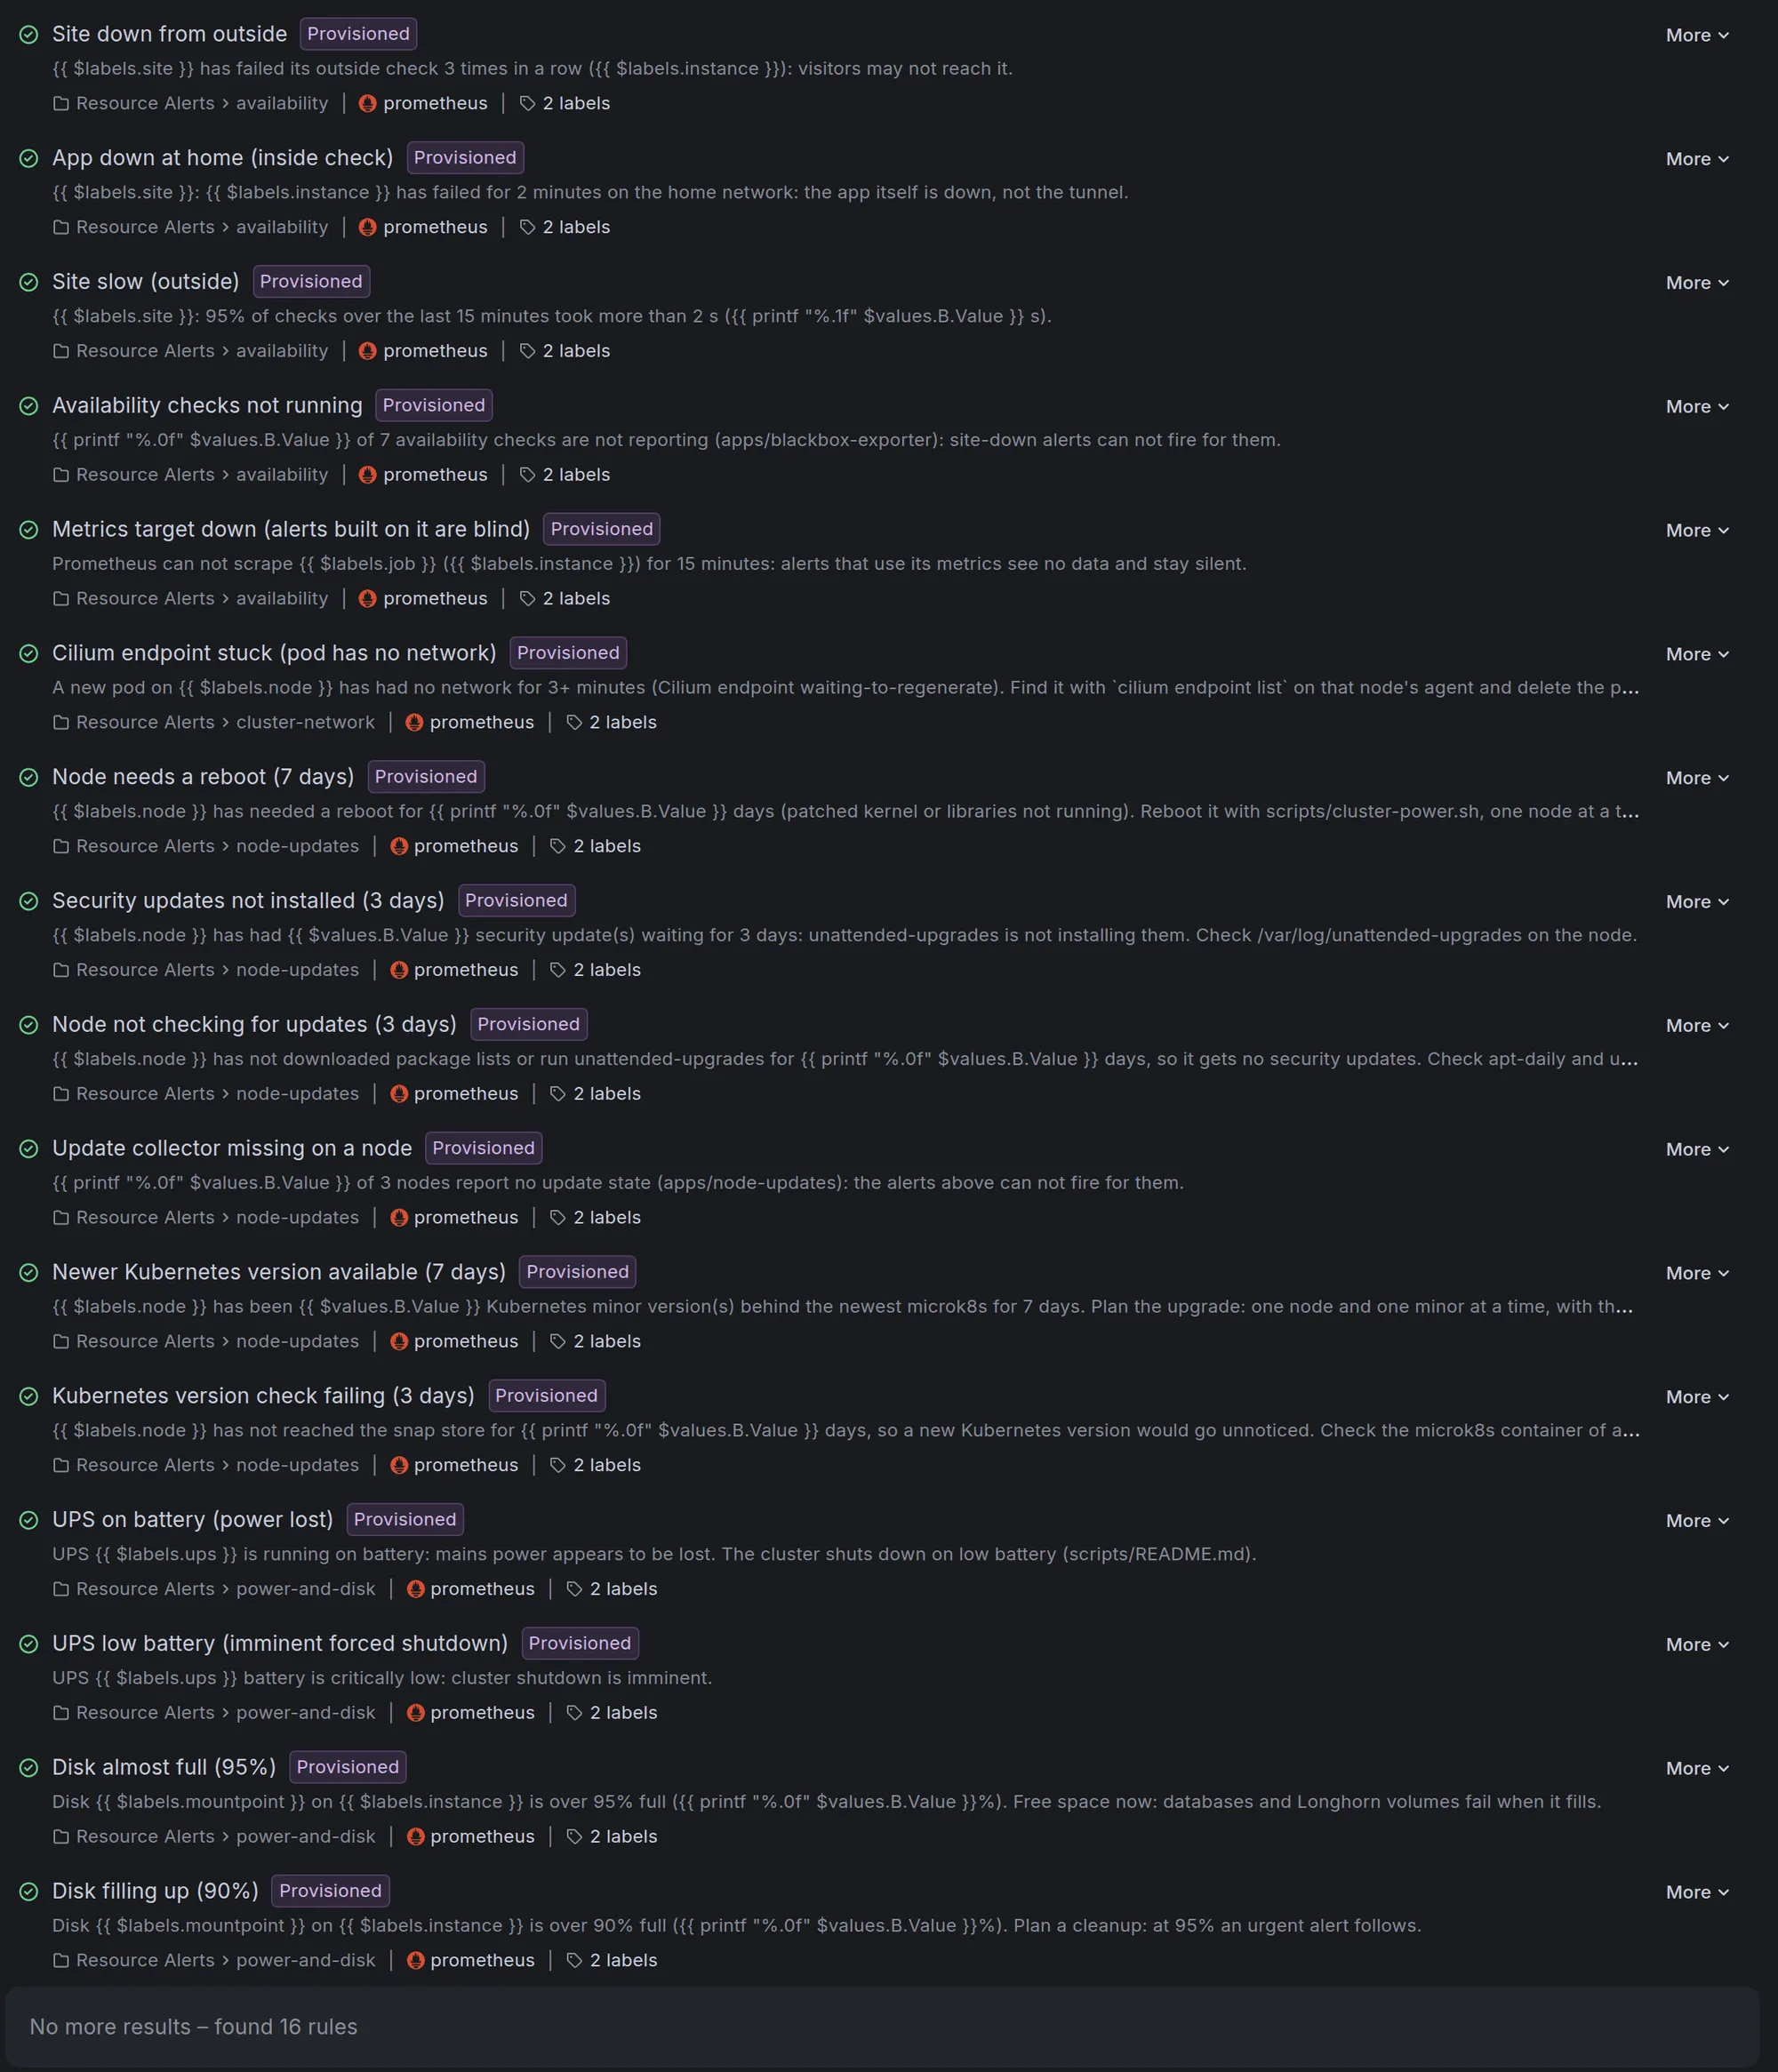
That’s the whole list: sixteen rules, all of them in git, each message written to say what’s wrong and where to start.
The next step is alerting on SLOs: an agreed target, like “99.5% of requests succeed over 30 days”, and alerts on how fast the error budget is burning, not on single errors. MTTK has its SLOs defined and its canary checks already use them; the burn-rate alerts are the next change. It’s the same idea taken one step further: page me when users are being hurt fast enough to matter, and stay quiet otherwise.
Badly set thresholds are what make on-call hell. An alert doesn’t have to mirror the SLO’s terms exactly. Its job is simpler: make sure an SLO violation is avoided, or caught fast.
Proving it holds up#
A system is as reliable as the last time you proved it. “It should survive a machine dying” is a hope; “I pulled the plug and here’s what happened” is evidence. So I test it, on purpose, on a schedule, the way Google calls DiRT (disaster recovery testing).
Power: the UPS#
The UPS exists because of a power cut in June, the story I promised in the first post. All three machines went down at once. When they came back, one ThinkCentre returned before the other, the storage system couldn’t bring the database’s volume up cleanly, and handed it an empty disk. The database saw an empty folder, did what databases do with an empty folder, and created a fresh one on top. I restored from the previous night’s backup and lost about 17 hours of data.
Two weeks later, a second power cut, and a different chain of failures. That’s when I stopped treating power as someone else’s problem.
It’s a CyberPower CP1350EPFCLCD, about €300.
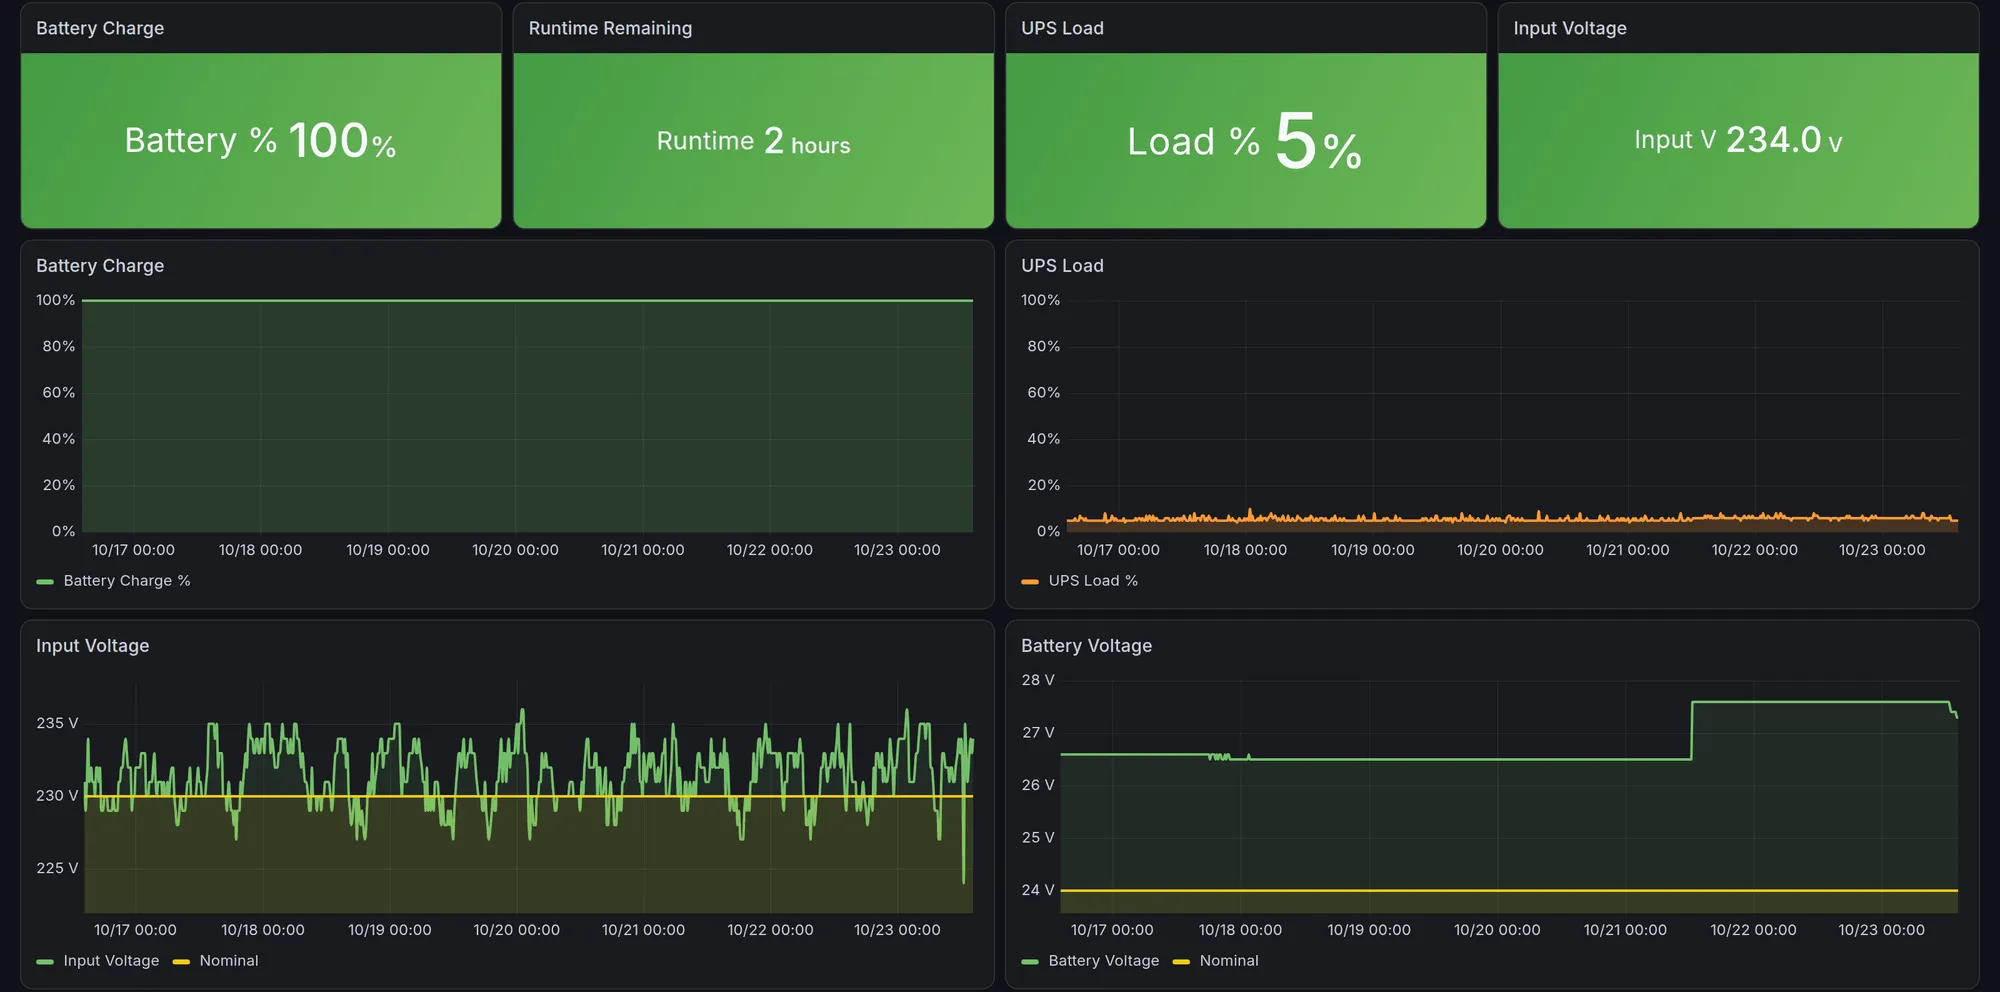
Today the three machines and the internet router are on the UPS. The Pi listens to it. After five minutes on battery, it starts an ordered shutdown: it pauses Argo CD so nothing fights back, stops every app that has a disk, and waits until every volume is safely detached. If the battery runs low, it powers the ThinkCentres off. At today’s load, about 5% of what it can carry, the UPS estimates around two hours on battery, so most cuts never get that far. When power comes back, a script brings everything back in the right order.
Then I tested it, by actually running it, in July. It found five bugs, none of which a one-machine-at-a-time restart would have shown:
- The script crashed on its first real run (a shell bug).
- The Pi had no way to reach the other machines, so in a real outage it would have silently done nothing.
- One machine’s network plugin crash-looped after the reboot, because its address lives on a network bridge.
- Even after that, the same machine’s pod network was dead: the operating system’s network manager was “fixing” the plugin’s interfaces as they were created.
- The storage system deadlocked on restart, waiting for a component that was waiting for it.
All five are fixed. Some of the fixes live on the machines themselves, where git doesn’t reach, and that’s written down in the report so a rebuilt machine gets them too. That test was worth more than any amount of reading the script.
The test plan#
After that I wrote the rest down: eight tests, gentlest first, each with a pass condition, an abort switch, and a rule that a problem found becomes an incident report and the test runs again after the fix.
| # | Test | Status |
|---|---|---|
| 1 | Planned reboot of each machine | ✅ done this month, no site check failed |
| 2 | Lose one copy of a volume | planned |
| 3 | Restore a volume from backup | ✅ done |
| 4 | Restore a database from its dump | ✅ done |
| 5 | The Cloudflare tunnel goes down | ✅ done |
| 6 | Argo CD down, and an app rebuilt from git | planned |
| 7 | Full power cut through the UPS | ✅ drained and shut down gracefully; 5 bugs found and fixed |
| 8 | Pull the plug on a machine, no warning | planned |
I’m not claiming it’s rock solid yet. I’m claiming I know which parts are proven and which aren’t, and the list above is how.
Post-mortems and tickets#
Every time something goes wrong, it gets a written report, in the shape of a proper post-mortem: what happened, a timeline, the root cause, what fixed it, and what changes so it can’t happen the same way again. Five so far: two power cuts, a storage migration, the network bug, and the UPS test. Each one is written for someone who doesn’t know the system, because in six months that’s me.
The follow-ups go into GitHub issues, never into the report as a to-do list: the report is the story, the issue is the work, and it’s done when it’s closed. Problems I’ve accepted for now (the Pi’s single disk, a few settings that only live in the cluster) go on a running known-issues list, so nothing is quietly forgotten. Right now there are about 30 open issues, grouped into three plans: security fixes from an audit I ran on myself, the Home Assistant move (done), and the tests above.
Judged as production#
Here’s the honest scorecard, if this were a service at work:
| Survives losing any one machine | ✅ control plane, storage, public sites (why three machines) |
| Changes reviewed, versioned, reversible | ✅ everything through git and pull requests that I merge, including the AI agents’ changes |
| Releases with staging, and canaries for one app | ✅ every release goes to staging first; one app ships through a canary that rolls back on its own |
| Pages only when something is broken now | ✅ 4 of 16 rules page; the other 12 are next-day notifications; none on CPU or memory; every message links its playbook |
| SLO burn-rate alerting | next |
| Power cut handled without me | ✅ tested once, rerun planned |
| Backups restored and proven | ✅ restored for real in both June power cuts, and again in the planned restore tests |
| Backups outside the house | ❌ every copy is under the same roof |
| A page when the whole house is offline | ❌ nothing at home can report its own power cut; a heartbeat to an outside service is set up next |
| Survives the house, the circuit or the internet connection failing | ❌ out of scope: one house, one region |
The last line is the one to keep in mind: this isn’t a global production system and doesn’t pretend to be. But the habits are the same ones I’d want anywhere: write it down, change it through review, page only when someone must act now, and prove recovery before a real failure does it for you.
Small enough to understand every part of. Big enough to break in interesting ways.
I want to know when something I host works badly enough that people would notice. I want to know about the rest too, just at a different priority: at the end of the day, I already have on-call at work.